
In the high-performance test and measurement world, data acquisition (DAQ) is king. A test operator’s top priority is making sure they “get the data on the disk,” as our CEO, Kurt Nichol, is fond of saying. Most OEM and homegrown systems are adept at this core requirement (although we are partial to our database recording solutions), so DAQ system purchase and development decisions often come down to other factors. One of the most important differentiators is visualization. Most OEMs and test
facilities have a list of required plots and dashboards for running a test. Typically, visualization requirements are most stringent for post-test analysis, but online visualization is often included in the long rubric of requirements found on an RFQ. Too often however, these plots, dashboards, and visualizations are treated as a final product—a minimum requirement to “set and forget.”
Reliable, pre-set dashboards are an absolutely critical piece of test-cell infrastructure. Engineers need to know where to look when they need information, and that information needs to be instantly available (exactly where they left it) every time. Dashboards help engineers make informed decisions about safety, data integrity, and next steps during runs. When visualization is poorly implemented or slow, tests are put at risk. Equipment can be damaged, data quality can suffer, and runs can be delayed. This is common knowledge for program managers. What is often overlooked is the mechanism by which dashboards are created. A checkmark on a requirement rubric might not indicate the time and effort that can go into creating and maintaining dashboards, the ability to add new visualizations mid-test, and the interactivity and flexibility of pre-set visualization.
Just because a dashboard can be created doesn’t mean it’s easy or fast to do so. With some tools, such as MATLAB and LabVIEW, it can take an entire day for a test operator to create a dashboard. While this is often done once before a test begins, last-minute changes close to test day can still incur expensive delays and missed opportunities for data collection. Most importantly, if visualization needs to be adjusted or added during a test run to better understand unexpected behavior, it is often
difficult or impossible depending on the tool and workflow.
Every engineer tries to prepare for as many possibilities as possible, and test requirements reflect that. But sometimes you don’t know what you don’t know. Even a well-written list of visualization requirements might miss a view that becomes critical later. That’s why a wide range of visualization tools is so useful beyond the exact items listed in the test requirements. When every tool is within reach, more problems can be
diagnosed and solved without slowing the test down.
Finally, minor adjustments to visualization often need to happen in real time while tests run. From zooming in on unexpected transients to changing the color or line width of a trace to better contrast two peak-hold plots, visualization is most useful when it isn’t completely static. If dashboards are inflexible, important moments can be hard to see and interpret. Conversely, fully interactive plots, diagrams, and 3D
elements give engineers the ability to zero in on the right information at the right time.
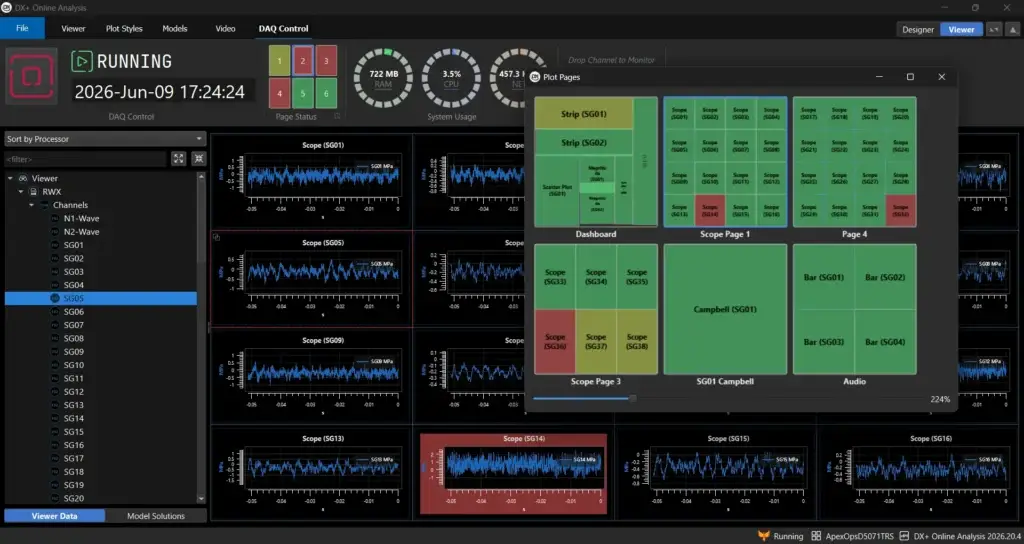
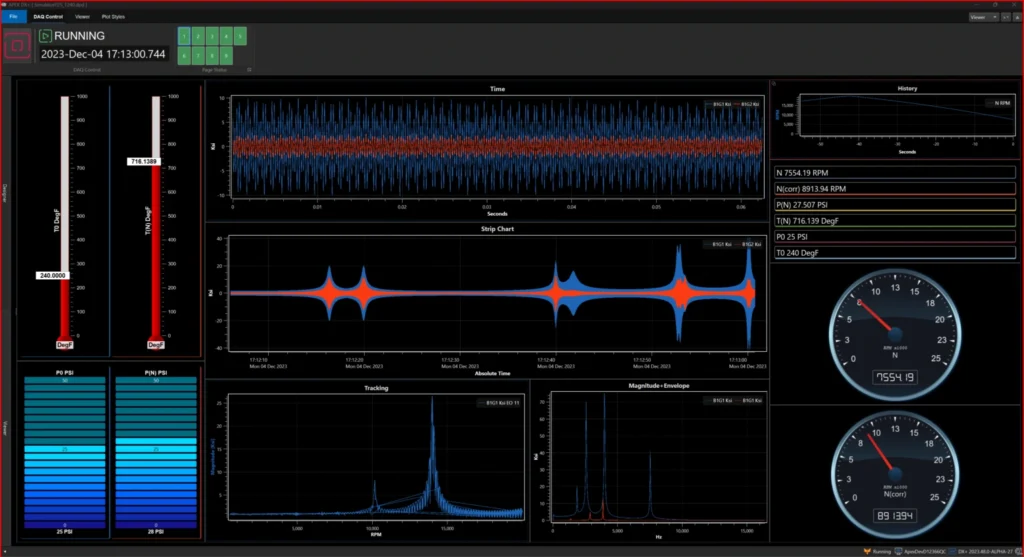
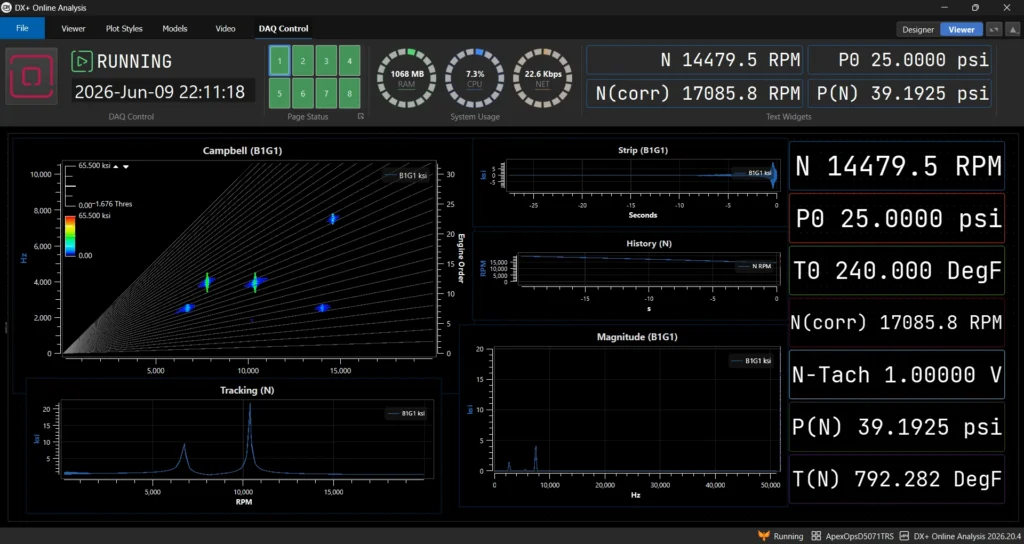
At APEX, we put special focus on visualization for all the reasons above: saving setup time, enabling new insights, and letting engineers interrogate data at the speed of thought. Our product, DX+, includes a drag-and-drop plotting engine that helps engineers create plots and dashboards in minutes—showing critical data, when and where they need it. Dashboards can be locked for required configurations, but then easily expanded and edited as required for on-the-fly analysis. And the same plotting engine used for post-test analysis is also available for real-time visualization.
No matter what system you use, visualization can make the difference between a smooth test and expensive delays. If you are a test operator or program manager, DX+ can help you build, adapt, and use visualization with far less friction. Fill out the contact form below to get in touch for a walkthrough and free demo to see how quickly you can create dashboards, adjust them mid-test, and accelerate analysis.